U.S Bank Freight Payment Index Q2 2024
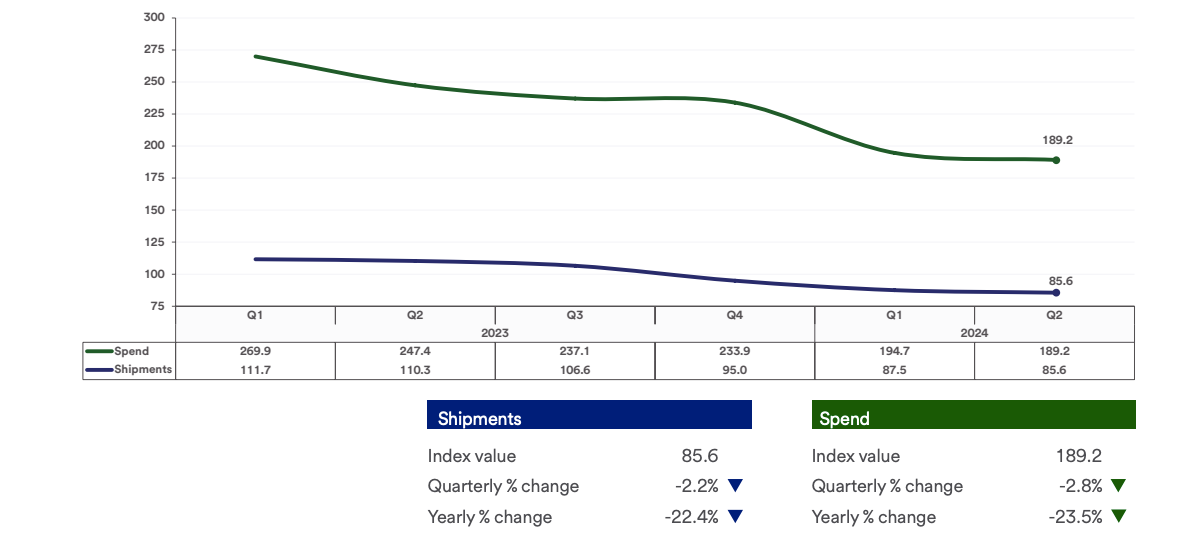
In the second quarter, the national truck freight market continued its downward trend. Both the U.S. Bank Shipments and Spending Indexes contracted from the first quarter, though the declines were less severe compared to recent quarters.


In the second quarter, the national truck freight market continued its downward trend. Both the U.S. Bank Shipments and Spending Indexes contracted from the first quarter, though the declines were less severe compared to recent quarters. Three out of five regions reported sequential shipment gains from the first quarter, indicating the market may be stabilizing.
The truck freight market was influenced by consumers spending more on services, especially experiences, rather than goods. This shift has contributed to a freight decline over the past two years. Approximately 65% of consumer spending is on services, which generates some freight, but carriers rely more on the goods economy for freight volume.
Shipper spending fell slightly faster than shipment volume from Q1, likely due to fewer shipments and falling diesel prices rather than significant freight rate decreases
Quarter-over-Quarter, Year-over-Year Analysis:
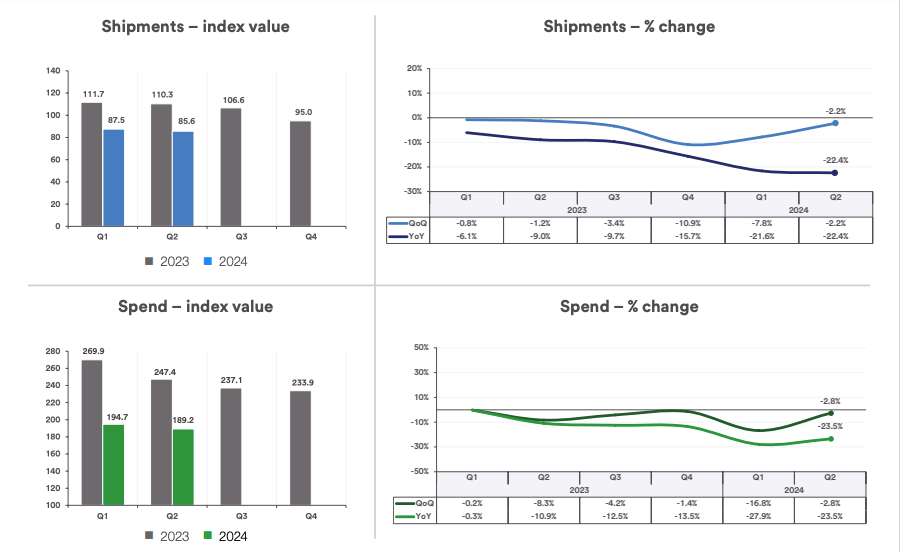
- Shipments: The U.S. Bank National Shipments Index contracted for the eighth consecutive quarter, declining 2.2% from the first quarter. Shipments in Q2 were 32.3% below the final quarter of 2019 and 22.4% lower than in Q2 2023
- Spending: The U.S. Bank National Spend Index fell 2.8% from Q1 2024. Compared to a year earlier, the spend index contracted 23.5%, a slightly larger decline than shipments over the same period.
📍 Regional Breakdowns
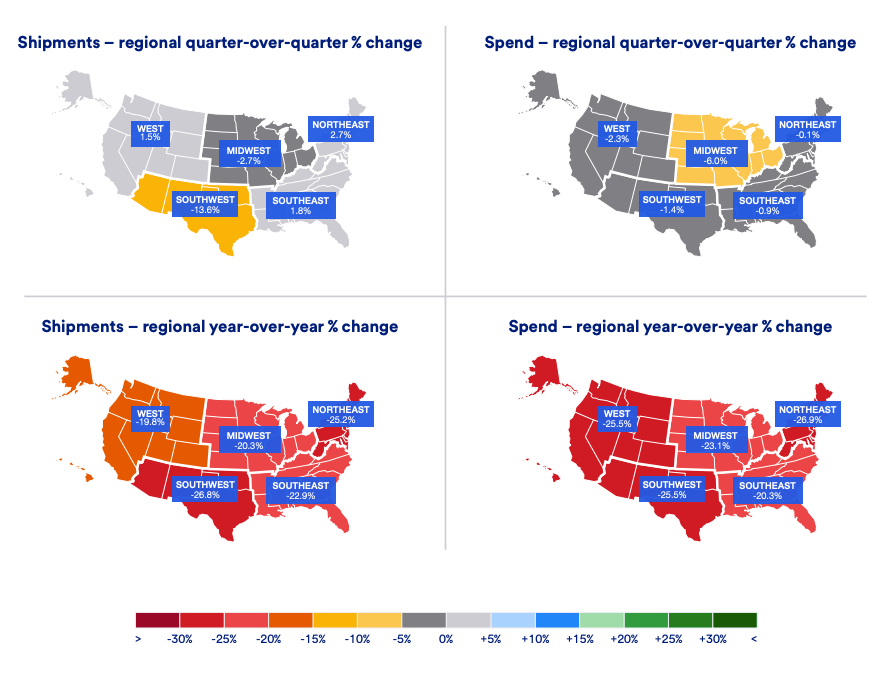
- West: Shipments increased 1.5% sequentially but remained 19.8% below the previous year. Spending contracted by 2.3%
- Southwest: Experienced significant shipment declines of 13.6% sequentially and 26.8% year-over-year. Spending decreased 1.4% sequentially
- Midwest: Shipments decreased 2.7% sequentially and 20.3% year-over-year. Spending decreased by 6%.
- Northeast: Shipments increased 2.7% sequentially after consecutive declines, but remained 25.2% below the previous year. Spending decreased by 0.1% in the Northeast.
- Southeast: Shipments increased 1.8% sequentially, ending a two-year decline, but were 22.9% lower year-over-year. Southeast spending declined 0.9%
“Our data is showing some signs that the very challenging freight market could be nearing a bottom,” said Bobby Holland, director of freight business analytics, U.S. Bank.
💡 About the U.S Bank Freight Payment Index
The U.S. Bank Freight Payment Index measures quantitative changes in freight shipments and spend activity based on data from transactions processed through U.S. Bank Freight Payment, which processes more than $42 billion in freight payments annually for shippers and carriers across the U.S. The Index insights are provided to U.S. Bank customers to help them make business decisions and discover new opportunities.